
Diffusing and Scaling Property Tax Incentives for Affordability
Defining and Prioritizing
With the myriad incentive structures in Chattanooga, Atlanta, Texas, and beyond, combined with the long slate of variables involved in each individual project, it has historically been difficult to assess the structure and value of one affordability program to another. As local programs grow more urgent and prevalent, it has never been as important to create such a tool and methodology.
We propose a methodology of comparing local tax incentive programs via standardized metrics that account for effects on key private underwriting metrics, including net operating income (NOI), yield on cost, cap rates, and internal rate of return (IRR). In modeling the balance of costs and benefits of affordability programs, we focus on three key additional metrics: Public Return on Investment, Friction Costs, and Private Internal Rate of Return Enhancement.
Public Return on Investment (PRI) compares public benefits (often in the form of reduced rent) to public costs (often in the form of lost tax revenue via a tax incentive). These costs and benefits should be time-weighted to account for the time value of money and calculated as a net present value:
PRI: First, the net present value of all the rent savings (from the affordable units) is calculated. This sum is then divided by the net present value of all of the reduced taxes from the tax abatement. Net present value is a methodology that discounts future cash flows into “today’s” dollars.
In a market environment in which development deals do not pencil (returns are below equity cost of capital) and / or affordability is optional, we would expect the PRI to be less than 1x (present value of subsidy is greater than public benefit). In an efficient market, the extent of this gap should be smaller. Due to changing market conditions, it can be challenging to estimate an exact “correct” ratio.
Friction Costs (FC) represent the difference between the value of the subsidy provided (e.g., taxes foregone) and the value received by the developer. For example, subsidies that often require help from specialist consultants and / or need additional high-cost financing can lead to significant incremental costs outside of a project’s true development costs. This metric can help local government leaders determine the most efficient allocation of public resources. For tax incentives, friction costs can be grouped into two costs: 1) legal and closing costs associated with obtaining the incentive; and 2) annual administrative costs for monitoring compliance with incentive mandates. There are also potential friction costs that are harder to quantify, including a developer’s level of comfort and familiarity engaging in what may be a more complex transaction; colloquially the “is it worth the headache?” cost.
FC: Calculated by taking the sum of up front Legal Costs, the net present value of Annual Compliance Costs, and (if quantifiable) an estimate for additional resources needed to handle the “headache” of a more complex transaction. That sum is divided by the net present value of total Estimated Reduction in Rents. FC is calculated as a percentage, with FC below approximately 5% considered to be relatively efficient, especially as compared to commonly used federal programs.
Private Internal Rate of Return Enhancement (PIRRE) measures the incremental benefit to private developers of every public subsidy offered for various affordability options. It is calculated by taking the net change in IRR to a developer as a result of the affordability program. Different tools can have very different effects: for example, cities may spend years setting up belowmarket interest loan funds while a property tax abatement could have had quicker and more efficient impact on enhancing IRR. When calculating the incremental IRR for enhancement, it is important to include the effect of Friction Costs.
The analysis also considers potential valuation impacts from increased cap rates due to buyers’ perceptions that restricted rents may lag market growth over time. Based on conventional underwriting methodologies, cap rate adjustments (and resulting valuation effects) typically reflect the differential between NOI growth with and without affordability restrictions, though this varies significantly by market. This effect on exit valuation is factored into the calculation of IRR.
PIRRE: Calculated by taking the difference between the private investor’s net IRR after the tax abatement and the private investor’s original IRR before the tax abatement.
PIRRE is calculated in percentage points (%pt). While the absolute PIRRE matters (a higher number means a higher incentive for developers), it is typically more important that the gross IRR reaches developers’ minimum return thresholds (this number will vary based on the investor’s targets and comfort with risk; under current market conditions, the mid-tohigh-teens might justify proceeding with a project).
Model Example: Full Tax Exemption for Mixed-Income Housing
Below highlights key metrics based on utilizing a hypothetical tax abatement for a development project of 200 units. We assume the program offers a full property tax exemption in exchange for 20% of units being held at 50% of AMI, and 10% of units being held at 80% of AMI. All metrics are hypothetical and reliant on several key assumptions regarding the geography and property’s rents, property taxes per unit, and cap rates. With those assumptions entered, the model boils down to consideration of the key metrics we propose standardizing.
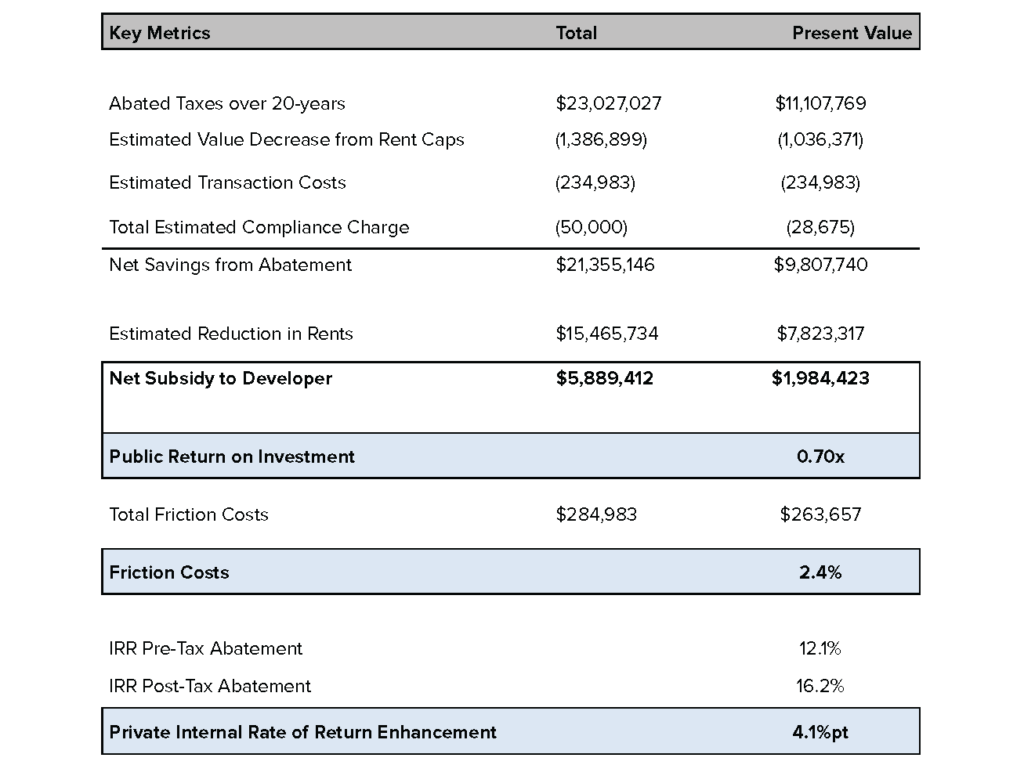
The ~$8 million of present value of reduced rents compares to ~$11 million of present value of abated taxes, resulting in a Public Return on Investment of 0.7x. By being relatively close to 1x, this demonstrates a net benefit to the developer without being overly generous — perhaps just enough sacrifice to make a project and its corresponding new affordable units and economic development viable. Friction costs are minimal, at ~2%, representing significantly more efficiency than many other affordable housing programs. Finally, the project’s IRR goes from 12.1% without the program to 16.2% with it. This demonstrates that the benefits to the developer could be sufficient to move this particular project from a likely unviable returns range to one that may convince investors and lenders to pursue it.
The Public Return on Investment is not too severe, the Friction Costs are minimal, and the Private IRR Enhancement is material, meaning this incentive program would likely result in a previously unviable project being executed — producing net new affordable housing units.
Introduction to the National Housing Crisis Task Force’s Model
Using the metrics and early methodology outlined above, the National Housing Crisis Task Force proposes building a standardized Underwriting Model that calculates the public and private costs, as well as the public and private benefits, of local affordability incentive programs. The model would standardize some key metrics in the context of tax incentive programs, such as Public Return on Investment, Friction Costs, and Private Internal Rate of Return Enhancement to compare real and hypothetical incentive programs. In doing so, the model will help localities efficiently structure incentives and maximize the number of affordable housing units built or preserved in their localities. Our proposed model focuses on accounting for the complexity of all input variables while also generating a neat, digestible output of standardized metrics.
Key standard modeling inputs include the project’s parameters, including number of units, unit types, proposed level of affordability, and size; rent levels, both market rate and affordable, and vacancy estimates; operating costs, including repairs and maintenance, marketing, utilities, insurance, and property taxes; development costs, including land value, hard costs, developer fees, and soft costs; financing assumptions, including senior and mezzanine debt levels and interest rates, and exit assumptions, including hold period and driven primarily by exit cap rate and transaction costs.
The public’s contribution assumptions are also accounted for via affordable rent levels, tax incentives, grants per affordable unit, below-market debt, free land, and project-based voucher rents.
These inputs generate net cash flows which generate an Internal Rate of Return for the project, with and without the incentive program in-place. All parties involved can easily compare a pure market-rate project to one that achieves the locality’s affordable housing goals, bridging the gap between what a private developer asks for and what a public entity can offer.
The initial model is under production in spreadsheet format, and with additional funding, the Task Force anticipates building out a more sophisticated web-interface model on an open platform for use by state and local leaders.
Diffusion and Scaling Via Standardized Modeling
The market writ large, and Task Force Members’ experience specifically, highlights myriad situations in which distrust or misunderstanding of key metrics was the bottleneck to the execution of compelling public-private developments. We propose that pursuing a dynamic, user-friendly model focused on property tax incentives will help close the gap between the public sector’s needs and private developers’ requests. By providing an open-source, objective analytical framework, the proposed model could reduce friction and unlock the scaling of some of the local “best practice” tax incentives that have sprung up around the country.
State and local government leaders interested in supporting the Underwriting Model’s development or testing the initial Excel model should contact the National Housing Crisis Task Force at info@nationalhousingcrisis.org. As we work to refine the tool, build our database, and develop market norms, we greatly value and welcome collaborating with localities to understand how their programs align with our proposed standardized metrics.